LimaCharlie is an endpoint security platform which which was developed by ‘Refraction Point’, a group of cyber-security experts. It’s key module serves the capabilities of an Endpoint Detection and Response (EDR) and can also be considered a Security Platform as a Service (SPaaS) which can help an organization tighten their security around their endpoints.
The EDR allows agents (users with the sensors installed on their systems) to create detection rules, FP rules, gather telemetry, run forensics capabilities, and even run their own solutions for detections and other purposes. Through a series of easy-to-use features, the platform offers individuals to automate several tasks (as we’ll see) which previously required human intervention.
Getting Started
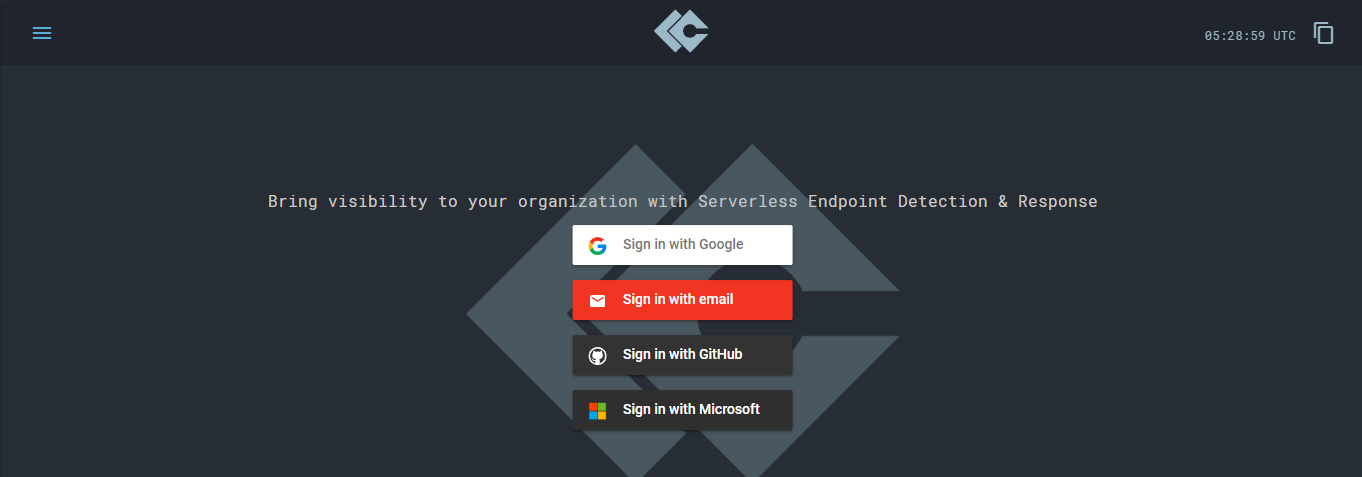
Although the full license of LimaCharlie (LC) is paid, we can evaluate the platform - thanks to their Cloud service. Head over to Lima Charlie and you should be greeted by a simple authentication screen.
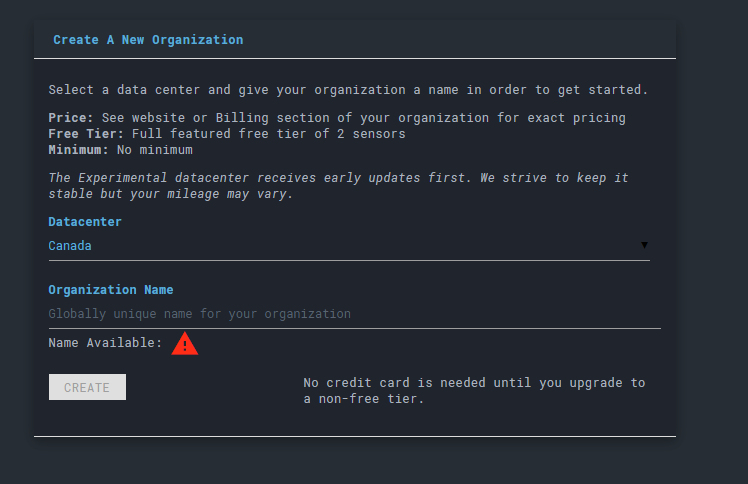
Once you’ve done that, the next screen should be your organizations. LC works on the concept of organizations and that all agents should be under one in order to be grouped together. You can create an example organization for tests purposes.
Though mind you - there will be a selection of the data center here which you’ll have to see in order to speed up your queries.
Go back to the dashboard and your organization should be ready. Head back into the organization you’ve just created. The dashboard should be empty since no agents are up. But, we can quickly setup an agent by completing these two steps:
- Head over to “Sensor Downloads” from the left navigation menu, and download a sensor for your operating system
- Head over to “Installation Keys” from the left navigation menu, and create a pair of keys for yourself
The rest of the steps should be mentioned in the downloads directory to get started with the sensor installer. Once done, head over to “Sensors” and your agent should be up! Et voila, you’ve just setup your first agent! It’s time to run some queries on this system and see what it has in stores for us.
Features
Let’s quickly dive into a few features which are offered to us by LC. One quick reminder, under this free serverless trial, you only get two sensor download permissions (and one organization). If you’d like to step out of this, you can subscribe to their premium offers.
Data Visualization
Through data visualization, you can view your agent’s activities over a specified period of time. This could be a day or 7, and the activties can be anything from identifying the hash, SID, IP address, or anything else. This can be a great use-case to search for a particular hash during an IR drill.
Sensor Access
In your Sensors tab, hover over the options available to you for your agent. You can press the “Go Live” button to get access to the agent and run live queries on the machine.
Live access can give you everything from IP addresses to connection dates, OS information, and access to file System and other stuff.
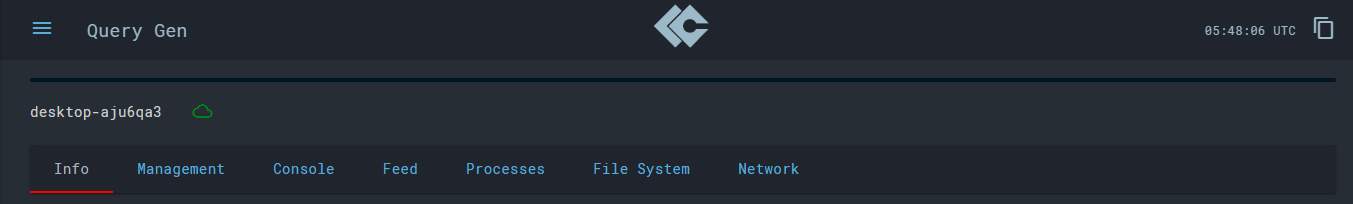
We have the following information for a sensor when we first enter it in live mode:
- Information
- Management
- Console
- Feed
- Processes
- File System
- Network
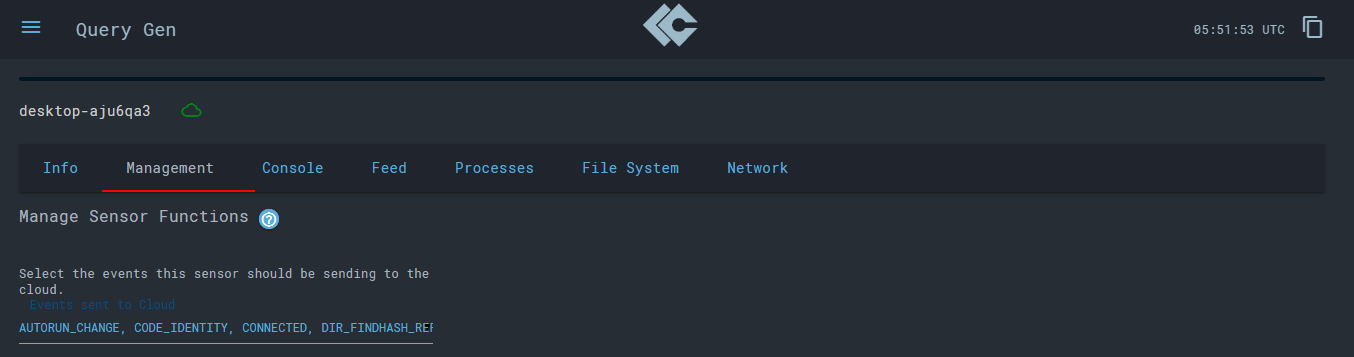
In the ‘Management’ tab, you can etup new events you’d like to send to the cloud at LC. I’ve let the default values be as they cover pretty much everything. Though in an actual organization, more thought-after selections can make much more impact.
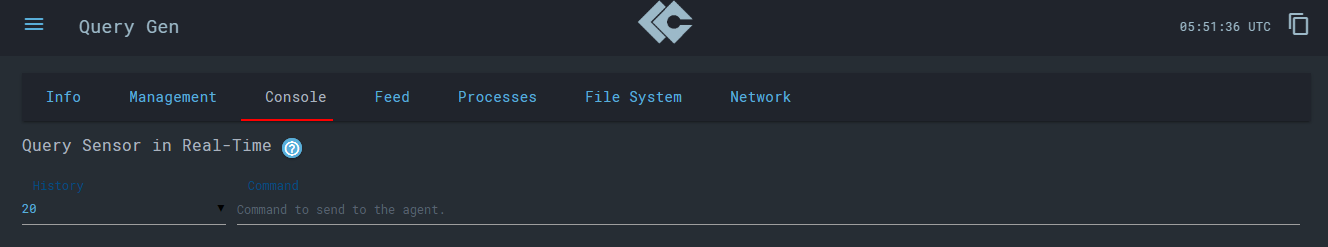
In the ‘Console’ tab, you can execute commands against your system to query information in a command/output manner. If you click over the command dropdown, there’s tone of commands already available to us. For example, I ran the command os_autoruns to get the list of programs which execute on start-up.
The ‘Feed’ section is the holy-grail. It’s live event logs which are forwarded from the sensor. This doesn’t just include logs from the event logging on Windows, but also collects network information and displays it back to you. Thsi is actually the best feature and can help you detect much more than you think. Checking out the live traffic to pick apart a C2 IP or perhaps a malicious executable can help analysts take the next step.
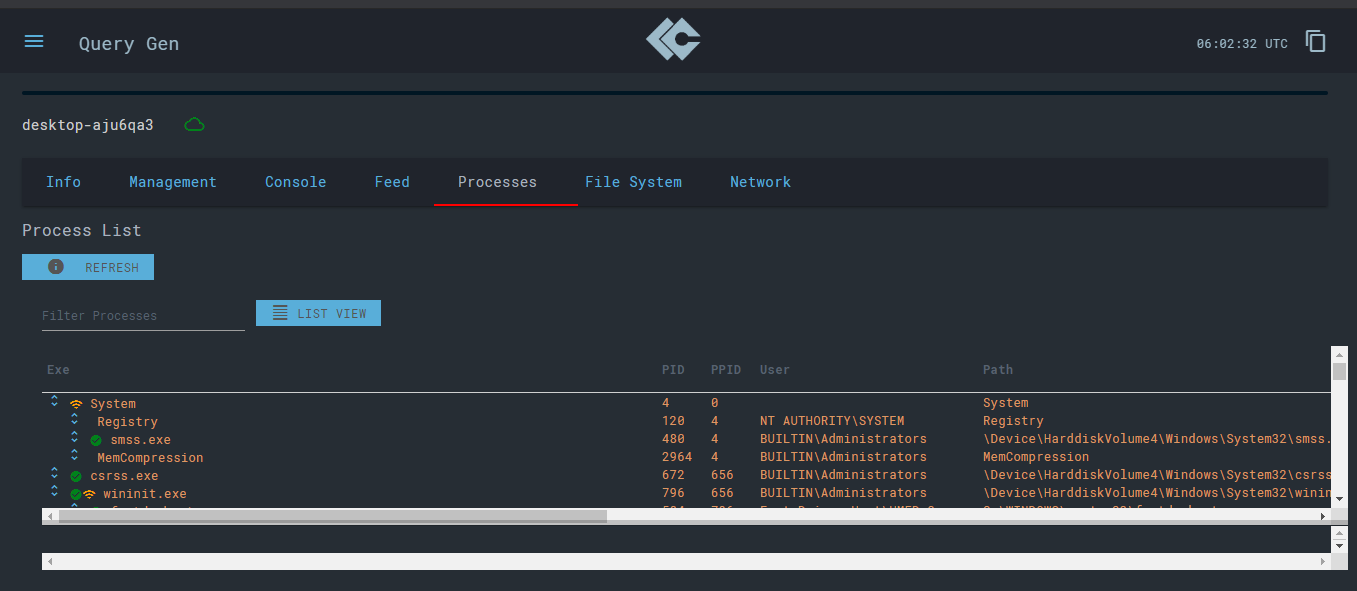
In the ‘Processes’ tab, you can run a view against a particular process running on your machine or check the list of processes which are returned by the sensor.
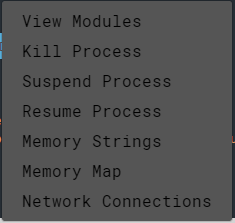
For a particular process, you also have access to several features including extraction of strings, identification of networking, and the ability to kill the process, if need be.
In the ‘File System tab, you can view the directory structure and interact with the file system of the agent. You can also select a particular file and downloadi it on your own machine in order to assess and analyze the file as per your needs.
Finally, in the ‘Networks’ tab, you can view the internet connections currently spawned along with the proceses creating them and much more information. These are like your flow logs, but slightly restrictive on the information. The search bar also allows for easy retrieval of a particular object from the result.
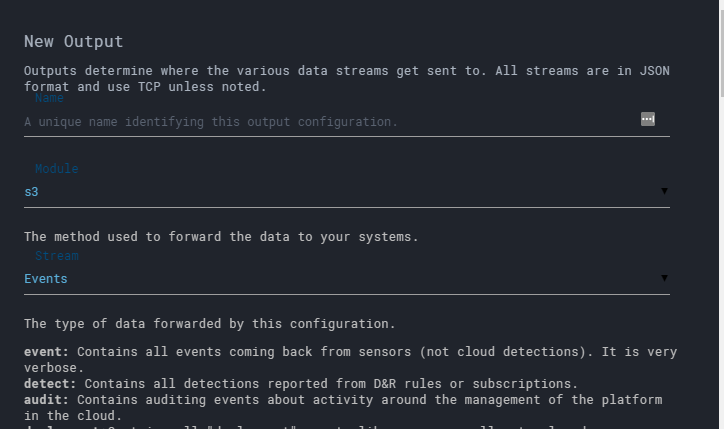
Outputs
Outputs offer an easy way to configure where the outputs of particular queries or detections should go. For example, I’d setup an S3 bucket on AWS and forward my events from here to the bucket itself. This is an easy way for me to store and retain the logs.
A slightly different use-case would be to send these detections to a SIEM solution, e.g. Splunk. Sending it to the platform will allow you to visualize the data, and correlate it with other information as well.
Response
The ‘Response’ tab is probably the best feature. It features an Incident Response sweep feature where you can simply state your host’s name and the sweep will begin against it. I’ve already run a sweep and the outputs of that will be available to me on my dashboard.
If I open the job up, I’ll see loads of events from the Responder (which runs this sweep), and view the commands it ran on my agent under this sweep. There’s tons of data in those results - unsigned binaries, sketchy connections, crashed applications, and much more which is vital to good IR.
Yara
Under the Yara tab, you can specify a source to collect yara rules and then run it against a host. You can specify your own rules as well and run those. The yara rule scan results are available to you in on the dashboard as well. If a detection is indeed found, it might be shifted to the ‘Detections’ tab for review or if the outputs are configured, it’ll be sent off to your desired location.
File/Registry Integrity Monitoring
The ‘FIM’ feature allows you to monitor changes to your directories and registry paths. The patterns it uses to match can either be a regex or a simple pattern to match items. If there are changes to the directorieso or paths, you should be notified of changes or mmodifications.
Payloads
The payload feature allows you to send out executables to the hosts with command line arguments. This can be used to run shell commands or perhaps distribute a binary across your hosts for setup or a different reason. The payloads are sent via the cURL command and then a singed URL is available to the uploader of the payload.
D&R Rules
Finally, the ‘Detection and Response Rules’ section allows you to write rules for your detections or FP logs. The detection rules are written in a YAML format. LC provides three modes to write rules for yourself:
- Basic - a rule builder will help you construct your rules
- Assisted - create D&R rules based on your logics
- Advanced - write your own rules in YAML format
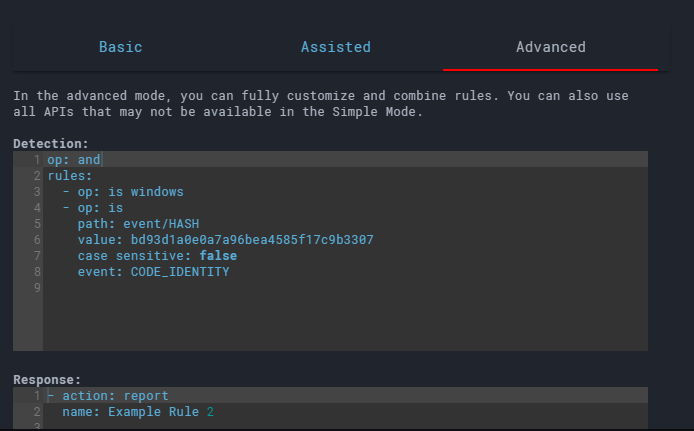
Writing a rule in either one, will transform it for you. You can review the final rule before even saving it for your machine. Let’s save the rule. We’ll be able to see our detections in the ‘Detections’ tab very soon.
Jobs
Since all queries can’t return their results instantly, your queries are put in a queue of tasks called ‘Jobs’. This will complete all jobs and display them for you on the dashboard. You can view the results, errors, or issues in the dashboard or the ‘Platform Logs’ section on your left hand.
Conclusion
That’s it for today folks. LimaCharlie is a worthwhile EDR solution if you’re looking forward to detecting bad actors over your endpoints!